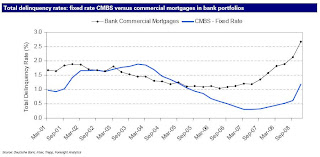
Above is a graph of Mortgage-Backed Securities' loan delinquency rate. As you can see, the delinquency rate increases dramatically near the end of 2008, and the current rate is likely even higher. The interesting thing about this chart is not the numbers- it's what they represent. These are Mortgage-Backed Securities for commercial loans. These are for loans that were made on commerical real estate, like shopping malls, business offices, etc.
The graph doesn't include data for 2009, but we do know that the largest commercial real estate bankruptcy in U.S. history occurred 2 weeks ago. General Growth Properties filed for bankruptcy. They own hundreds of shopping malls across the United States. You have almost certainly shopped in a mall that they own. To see a list of their properties, go here and search their directory.
So, how big is this crisis? The graph below represents the amount of money tied up in Commercial Mortgage Backed Securities, and the dates at which these loans mature.

Since 10 years is the standard maturation for these loans, many of them won't mature until 2017, but that's if the commercial tenants don't walk away and close their businesses first. This is why General Growth Properties had to file for bankruptcy- the tenants in their shopping malls have started closing their doors (and not paying their rent.) There is over $1 trillion tied up in Commerical Mortgage Backed Securities. Now we begin to see why the banks who received federal bailouts haven't been making loans to consumers as expected- they're stuck with the bill for these commercial real estate loans as well, among other things.
